

If you’ve ever asked “What’s a good Amazon FBA profit margin?” you’re not alone—and you’ve probably noticed that most answers depend on what people mean by “profit margin” (gross vs net), and which costs they include (especially ads, returns, and inbound logistics).
This guide is designed to help you set a realistic target and calculate your margin per SKU in a way that holds up in the real world. It’s not affiliated with Amazon, and it avoids guarantees—because fees, ads performance, and operational costs change over time.
What’s a “good” Amazon FBA profit margin?
A “good” Amazon FBA profit margin usually means net profit margin per SKU after Amazon fees and your real operating costs—and it’s “good” only if it can survive normal swings in ads, returns, and inbound costs.
| Quick benchmark (directional, not a promise) | Why it’s considered “good” | What changes the answer most |
|---|---|---|
| Low / fragile: single digits net margin | Small cost changes can erase profit | Heavy PPC, high returns, fee sensitivity, unexpected prep/rework |
| Healthier: low-to-mid double digits net margin | More room for volatility and reinvestment | Category competition, price pressure, storage exposure, inbound cost |
| Strong: mid double digits and up (net) | Better buffer for growth and surprises | Brand strength, ad efficiency, packaging/quality, operational control |
- “Good” varies most with: PPC (ACoS/TACoS), return rate, Amazon fee profile, landed cost per unit, and avoidable rework.
- Net margin is the decision-grade benchmark; gross margin alone can look great while net margin is weak.
Small caveats that matter:
- The right target depends on category, competition, and how ad-driven your sales are.
- Fees and requirements change; treat your target as something you revisit, not a forever number.
From here, the fastest way to get clarity is to build a per-SKU model that includes all major cost lines.
Gross vs net vs contribution margin (and which one to track)
Gross, net, and contribution margin are all useful—but for different decisions. Most “profit margin” debates happen because sellers compare numbers that include different cost layers.
| Margin type | Includes (typical scope) | Best for | Common mistake |
|---|---|---|---|
| Gross margin | Selling price minus COGS (product cost) | Early sourcing checks and supplier comparisons | Treating gross margin as “profit” while ignoring fees/ads/inbound |
| Contribution margin (per SKU) | Gross margin minus variable selling costs (Amazon fees + ads + per-unit shipping/prep allocations) | Pricing decisions, reorder decisions, SKU keep/kill decisions | Forgetting ads, returns allowance, or landed cost allocation |
| Net profit margin | Contribution margin minus broader operating costs (tools, staff, overhead you choose to allocate) | Business sustainability and long-term planning | Comparing net margins across sellers without consistent overhead rules |
- Overhead allocation is personal. Choose a consistent method and stick with it.
- Don’t compare two “net margins” unless the cost scope is truly the same.
A simple rule: use contribution margin to run your SKU decisions week-to-week, and net margin to check business health periodically.
Quick definitions (what’s included at each layer)
- Gross margin: what’s left after product cost (COGS) is paid. Useful for sourcing, but incomplete for Amazon decisions.
- Contribution margin: what’s left after the costs that scale with each sale (fees, ads, per-unit landed cost and prep allocations). Best for SKU decisions.
- Net margin: what’s left after you also account for operating costs you carry as a business.
Caveat: Consistency beats perfection. Pick a scope and keep it stable so your comparisons stay meaningful.
Which margin to track weekly vs monthly
For most sellers:
- Track contribution margin per SKU more frequently (weekly or bi-weekly) because it reacts fast to price changes, fee changes, and ad performance.
- Review net profit margin less frequently (monthly/quarterly) to reflect business-level costs and longer trends.
Caveat: If your ads spend or returns swing a lot, tighten your review cadence and use a conservative scenario, not a single snapshot.
Once you know which margin you’re tracking, you can calculate it cleanly with a repeatable workflow.
How margin expectations change by business model (private label vs wholesale vs arbitrage)
Profit expectations differ because pricing control and cost structure differ.
| Model | Typical margin pressure points | Why lower margins may still work |
|---|---|---|
| Private label | PPC during launch, packaging/quality, inbound planning, price competition | If you can improve conversion and reduce returns over time |
| Wholesale | Buy cost, competitive pricing, limited differentiation | If velocity is high and operations are tight |
| Arbitrage | Limited pricing control, sourcing volatility, competition | If turnaround is fast and returns are low |
Caveat: Category and seller execution matter as much as the model label. Use the same per-SKU model either way.
Now let’s calculate your margin per SKU in a way that won’t surprise you later.
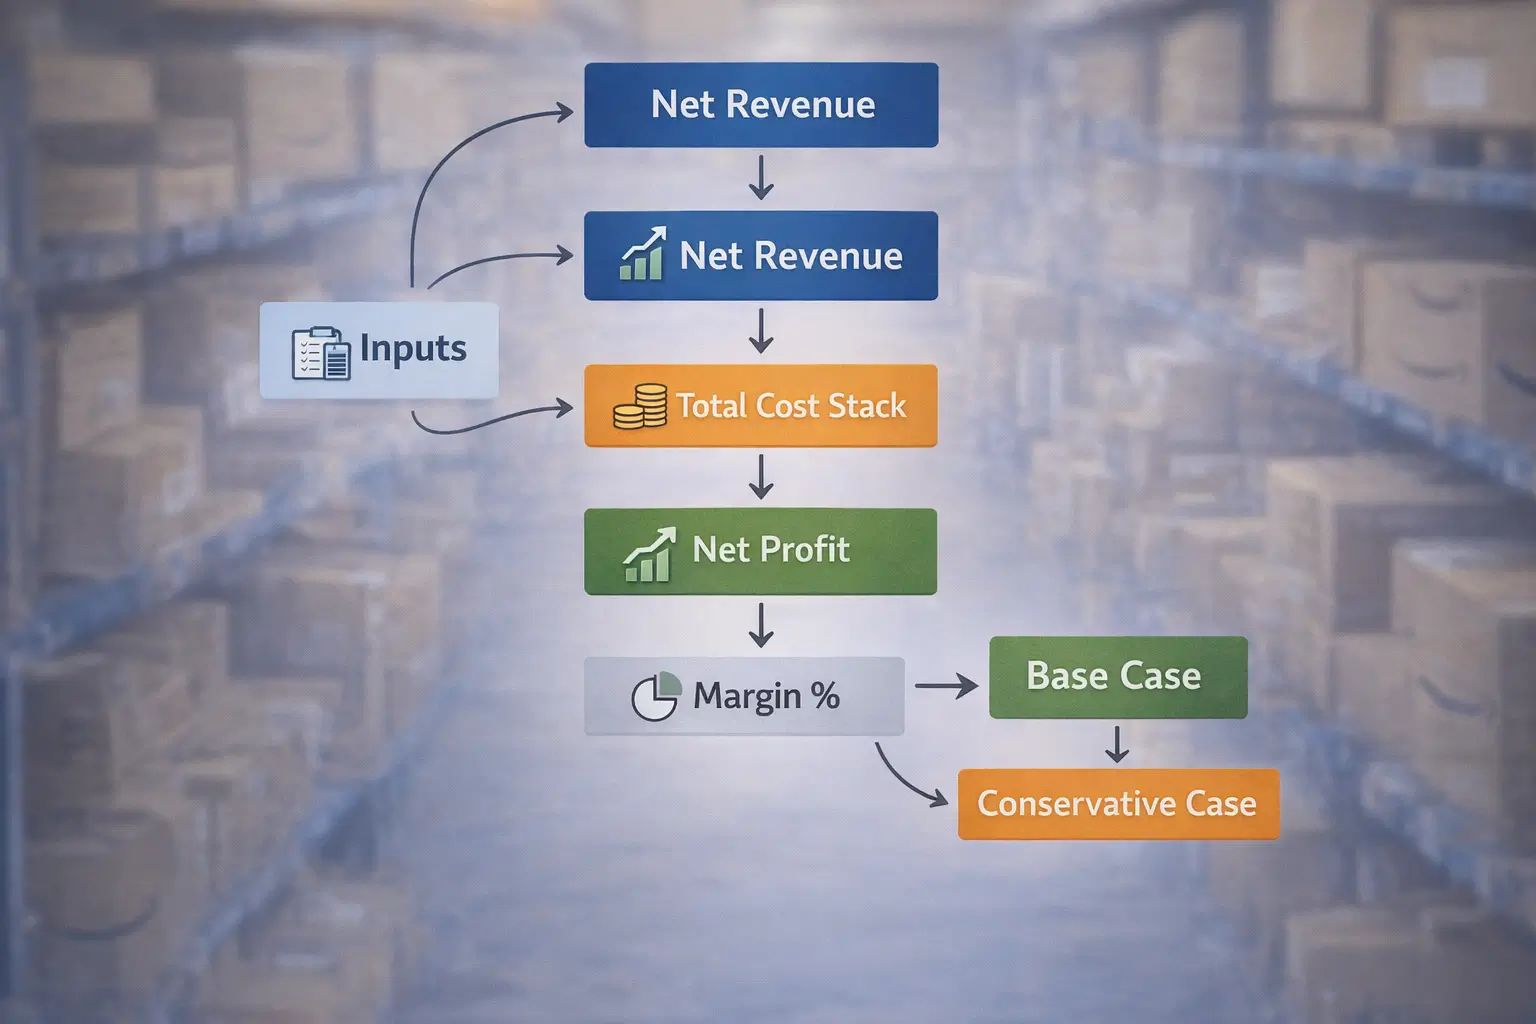
How to calculate Amazon FBA profit margin per SKU (step-by-step)
At the SKU level, profit margin is straightforward: calculate net profit per unit, then divide by net revenue using a consistent cost scope.
Here’s the core formula (per unit):
Net profit = Net revenue − Total costsProfit margin (%) = (Net profit / Net revenue) × 100
- Model per SKU (not only blended account averages) so you can make clean pricing and reorder decisions.
- Use a base case and a conservative case because ads, returns, and inbound costs fluctuate.
Boundary conditions:
- Coupons and discounts reduce net revenue.
- Returns should be modeled as an expected cost (even if reimbursements sometimes offset part of it).
Inputs you need (and where to get them)
| Input you need | Examples | Where to find it | Common mistake |
|---|---|---|---|
| Selling price & discounts | List price, coupon, promo | Your listing settings + promotions | Using list price while ignoring coupon/promo |
| COGS (product cost) | Unit price, packaging cost | Supplier invoices / POs | Omitting packaging inserts or bundle components |
| Amazon fees (categories) | Referral, FBA fulfillment, storage | Amazon fee documentation + your reports | Using outdated fee assumptions |
| Ads cost assumptions | ACoS/TACoS targets | Amazon Ads reports | Modeling only “best-week” ads performance |
| Landed cost per unit | Inbound freight, delivery, duties/taxes where applicable | Freight/prep invoices + shipping plan | Treating “shipping” as one vague number |
| Prep/rework allowance | Labeling, kitting, rework risk | Supplier/prep workflows + invoices | Assuming zero rework or zero mistakes |
| Returns allowance | Expected return rate impact | Category history + your data | Ignoring returns because they “might not happen” |
Caveat: Fees and requirements change; use official fee pages and your own reports to keep inputs current.
With inputs gathered, the actual calculation becomes a simple repeatable routine.
The per-SKU calculation workflow (with a simple template)
- Start with net revenue per unit
- Selling price
- minus coupon/discount impact (if used)
- Subtract product cost (COGS)
- Include product, packaging, inserts, and any bundle components.
- Subtract Amazon selling costs
- Referral fee and fulfillment costs (as applicable)
- Add other Amazon cost categories that apply to your case (for example, storage exposure you expect during holding periods).
- Subtract ads cost (modeled)
- Use a realistic assumption based on your goals and historical performance (base case vs conservative case).
- Subtract landed cost and prep allocations
- Allocate inbound freight + delivery + duties/taxes where applicable + prep costs per unit.
- Use a consistent allocation method (per unit, per carton, or by cubic volume—just keep it consistent).
- Subtract an allowance for volatility
- Returns allowance
- Rework/damage allowance (especially if packaging or labeling is complex)
- Compute net profit and margin
- Net profit = net revenue − total costs
- Margin (%) = net profit / net revenue
Illustrative example (for math only, not a “typical” Amazon result):
- Net revenue: $30
- Total costs: $24
- Net profit: $6
- Net margin: 20%
Caveat: Avoid “perfect math” on day one. A useful model that you update beats a perfect model you never use.
Handling coupons, promotions, and returns in your margin model
- Coupons and promotions reduce net revenue. Model your “real selling price” after discounts, not the sticker price.
- Returns are not just a customer service issue—they’re a margin issue. Model returns as an expected cost (even a simple allowance is better than pretending it’s zero).
- If you’re in a category with volatile return behavior, your conservative case should assume a worse return impact than your base case.
Caveat: Early launch data can be noisy. Revisit your assumptions after you have stable sales and ad data.
Now let’s lock down the full list of costs that should be in your model.
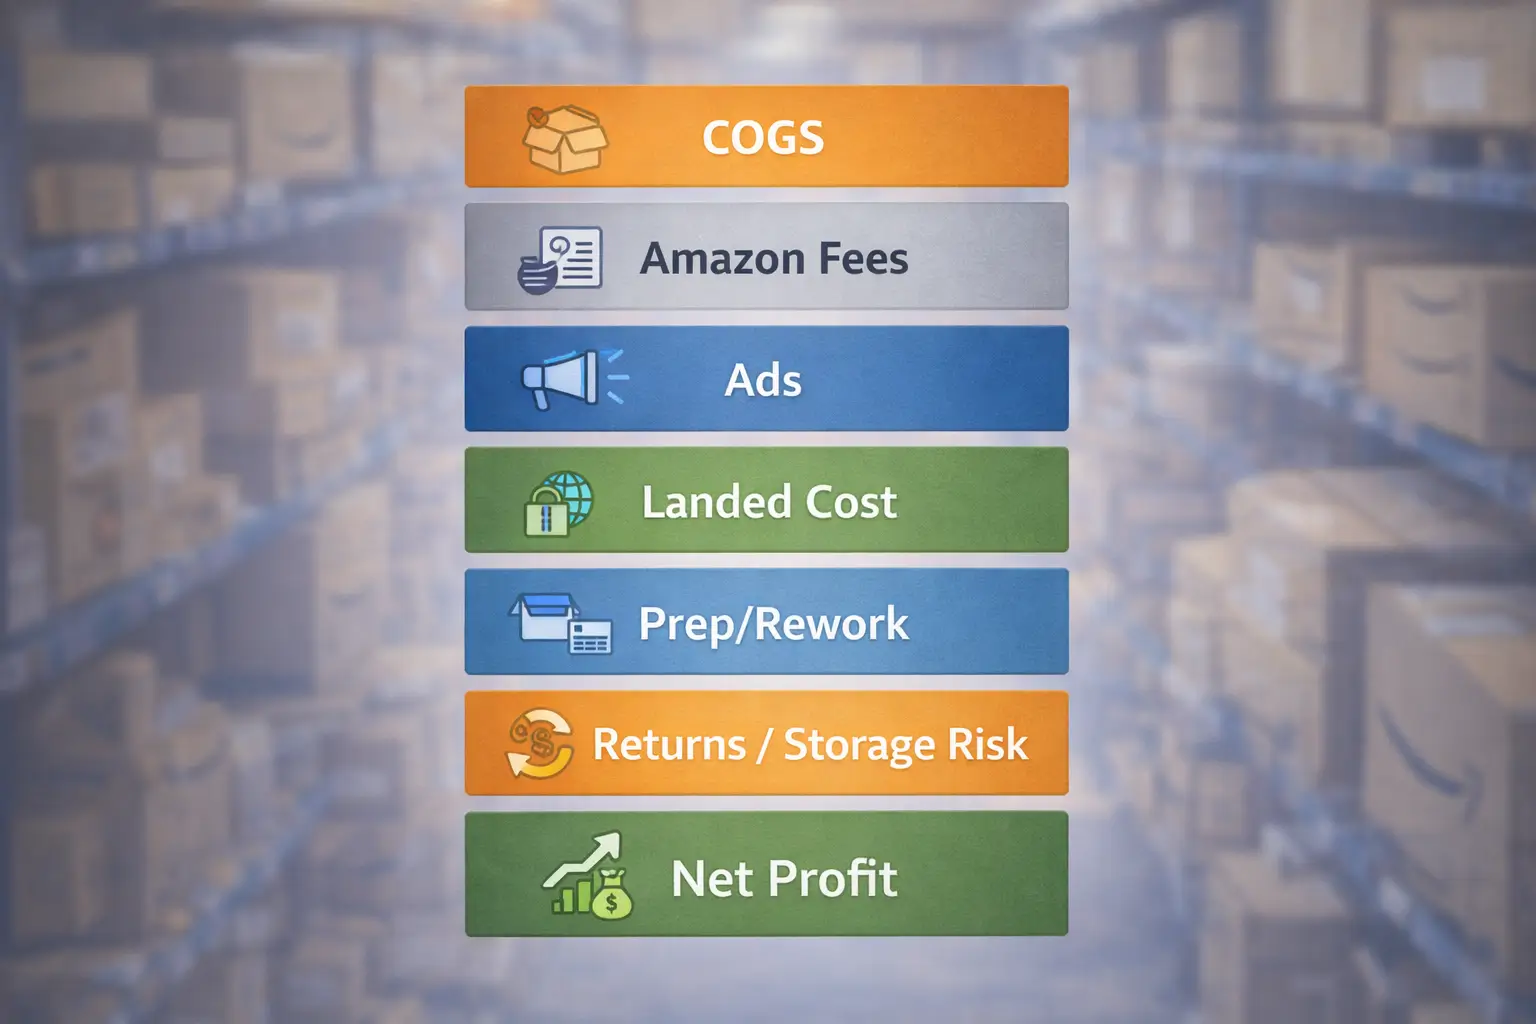
The complete cost stack (what sellers forget most)
A profit margin target is only useful after you’ve included a complete cost stack. Most “my margins disappeared” stories come from missing one of these buckets: ads, landed cost, prep/rework, returns, or inventory holding costs.
- Some costs are “fixed-ish” per unit (COGS, fee categories), while others are volatile (ads, returns, storage exposure).
- The goal isn’t to predict the future perfectly—it’s to avoid blind spots that make your SKU look profitable when it isn’t.
Grouped checklist (copy/paste friendly)
Product costs (COGS)
- Unit cost from supplier
- Packaging materials (including inserts, polybags, bubble wrap where needed)
- Bundle/kitting components (if applicable)
Amazon selling costs
- Referral fee (category-based)
- FBA fulfillment costs (size/weight dependent)
- Storage exposure (especially if inventory sits longer than planned)
- Other Amazon fees that apply in your scenario (for example, removal/disposal if you plan it)
Advertising and promotions (commonly missed)
- PPC spend (modeled as base case + conservative case)
- Coupons/discounts and their revenue impact
Inbound & landed cost (commonly missed)
- China-side pickup/transfer (if applicable)
- International freight (sea/air/express)
- Destination delivery to Amazon or your staging location
- Duties/taxes where applicable
- Insurance or special handling where relevant
- Allocate these per unit consistently
Prep, labeling, and rework risk (commonly missed)
- FNSKU labeling workflow (who applies labels, how quality is checked)
- Carton labeling/pallet labeling (if applicable to your inbound plan)
- Kitting/bundling labor
- Rework allowance (mislabels, packaging fixes, exceptions)
Post-sale and exception costs (commonly missed)
- Returns and refunds allowance
- Damaged inventory allowance
- Removal/disposal allowance (if your plan includes it)
Caveat: Not every fee category applies to every seller or SKU. What matters is being explicit and consistent.
A simple way to avoid over-trusting a single snapshot is understanding which costs move the most.
Fixed vs variable costs (so you don’t over-trust a single snapshot)
Fixed-ish (more stable per unit):
- COGS
- Many Amazon fee categories (though the rate cards can change)
Variable (changes with strategy and conditions):
- PPC and promotions
- Returns and refunds
- Storage exposure (depends on how long inventory sits)
- Inbound/landed cost (varies by season, routing, carton efficiency, consolidation choices)
- Rework and exception handling (depends on process discipline)
Caveat: In peak seasons and during major pricing changes, variability tends to increase. Your conservative case should reflect that.
If you want a fast sanity check on Amazon fee impact, the official calculator can help—just don’t treat it as the full answer.
Using Amazon’s FBA Revenue Calculator (and what it doesn’t include)
Amazon’s FBA Revenue Calculator is best used as an Amazon-fee estimator and a way to compare FBA vs your own fulfillment—not as a complete profit model.
How to use it (simple steps):
- Open Amazon’s FBA profitability calculator (Revenue Calculator).
- Find a product in the catalog (or enter your item dimensions/weight and price where supported).
- Review the estimate for Amazon fees and fulfillment costs.
- Record the outputs as inputs for your per-SKU model.
What you still need to add manually:
- PPC/ad costs (ACoS/TACoS assumptions)
- Inbound/landed cost per unit (freight + delivery + duties/taxes where applicable)
- Prep, labeling, and kitting costs
- Returns and exception allowances (damage/rework/removal if relevant)
Caveat: Fees and programs update over time. Always validate your assumptions with current Amazon documentation and your own reports.
Official links (may require login):
Amazon FBA profitability calculator (Revenue Calculator) ·
How to estimate profits with the FBA Revenue Calculator ·
Amazon selling fees (public overview)
If your products are sourced overseas, your margin usually moves more from landed cost and operational discipline than from small tweaks in a calculator.
How shipping, consolidation, and FBA prep affect your margin (landed cost + rework risk)
Inbound logistics and prep are margin levers because they affect cost per unit and how often you pay for avoidable fixes (rework, relabeling, repacking, exception handling).
- Landed cost is more than “shipping.” It’s the all-in cost to get sellable inventory to the point where Amazon can receive it correctly.
- Carton planning matters because dimensional efficiency can change per-unit cost, and poor planning can create expensive surprises.
- Process quality matters because a small labeling or packaging error can turn into repeated rework across many units.

Boundary conditions:
- Inbound costs vary by season and routing; plan scenarios, not single-point certainty.
- Product requirements vary by type; verify current prep/packaging/label guidance before you finalize packaging.
Official references (may require login):
Prepare your products for FBA shipping ·
Product packaging requirements
What “landed cost per unit” should include
Landed cost per unit typically includes:
- Origin-side pickup/transfer (where applicable)
- International freight (mode depends on your plan)
- Destination delivery to Amazon (or to a staging warehouse/3PL if you use one)
- Duties/taxes where applicable
- Prep/label/kitting costs and any required packaging work
- An allowance for exceptions (rework/damage risk)
Simple allocation tip:
- If you don’t have a perfect allocation method, use a consistent one (per unit, per carton, or per cubic volume) and keep it stable across SKUs.
Caveat: Duties/taxes depend on product classification and shipment specifics. Treat them as case-by-case, not a universal line item.
Margin-protection levers (consolidation, carton planning, prep accuracy)
Consolidation strategy
- Combine multi-supplier inventory into one outbound plan when it reduces duplicated handling and avoids partial shipments.
- Build one carton plan across suppliers to avoid inefficient carton sizes and mismatched labeling.
Carton planning
- Standardize cartons where possible to reduce surprises and simplify receiving.
- Confirm carton dimensions/weights before shipment so your inbound cost assumptions stay realistic.
Labeling and packaging discipline
- Decide who applies FNSKU labels and how you validate them (spot checks, photo records, scan checks).
- Align packaging with Amazon’s stated packaging requirements to reduce preventable exceptions.
Inspection and exception prevention
- Catch issues early (wrong SKU, missing labels, damaged packaging) before goods move into international freight.
- Keep a simple record trail (what was received, what was fixed, what was shipped) so you can isolate and prevent repeat errors.
Caveat: Some changes trade cost for time or vice versa. Evaluate the risk of stockouts and rush shipping when you change inbound plans.
If you source from multiple factories, a short preparation checklist can prevent a lot of rework and margin leakage.
If you source from multiple factories: what to prepare before you ask for help
If you’re coordinating multiple suppliers, you’ll get better outcomes (and fewer surprises) if you prepare a basic “inbound pack” before involving a prep or forwarding partner:
- SKU list and intended pack configuration (single units, multipacks, bundles)
- Carton dimensions/weights per supplier (or best estimates if production isn’t finished)
- Labeling plan (FNSKU labels, carton labels, and any special handling notes)
- Target destination (Amazon FC, staging warehouse, or 3PL) and any appointment constraints you know
- Commercial invoice and packing list basics (as available)
- Your margin model assumptions (target margin, conservative case, and key risks)
FBABEE supports China-side consolidation, prep, and door-to-door shipping for Amazon sellers (fbabee.com). A partner can’t guarantee outcomes, but strong process control can help reduce avoidable rework and improve cost visibility.
Now that you understand how costs can shift, you can set a safer target that accounts for launch reality and volatility.
Setting a safe margin target: launch vs steady-state (plus a stress-test buffer)
Your margin target should reflect two realities:
- Launch usually requires heavier PPC and promotions, which compress margin.
- Steady-state can improve, but only if your ad efficiency and returns behavior stabilize.
A simple decision tree (base case vs conservative case):
- If your base case margin is healthy and your conservative case margin is still positive and stable:
- You likely have room to launch or reorder without one small shock wiping out the SKU.
- If your base case looks good but your conservative case collapses:
- Treat it as a warning sign. You probably need stronger cost-side levers (packaging, inbound plan, ad efficiency) or a pricing rethink.
- If both base and conservative cases are weak:
- The SKU is likely fragile unless you have a strong reason it will improve quickly (and you’re willing to time-box that bet).
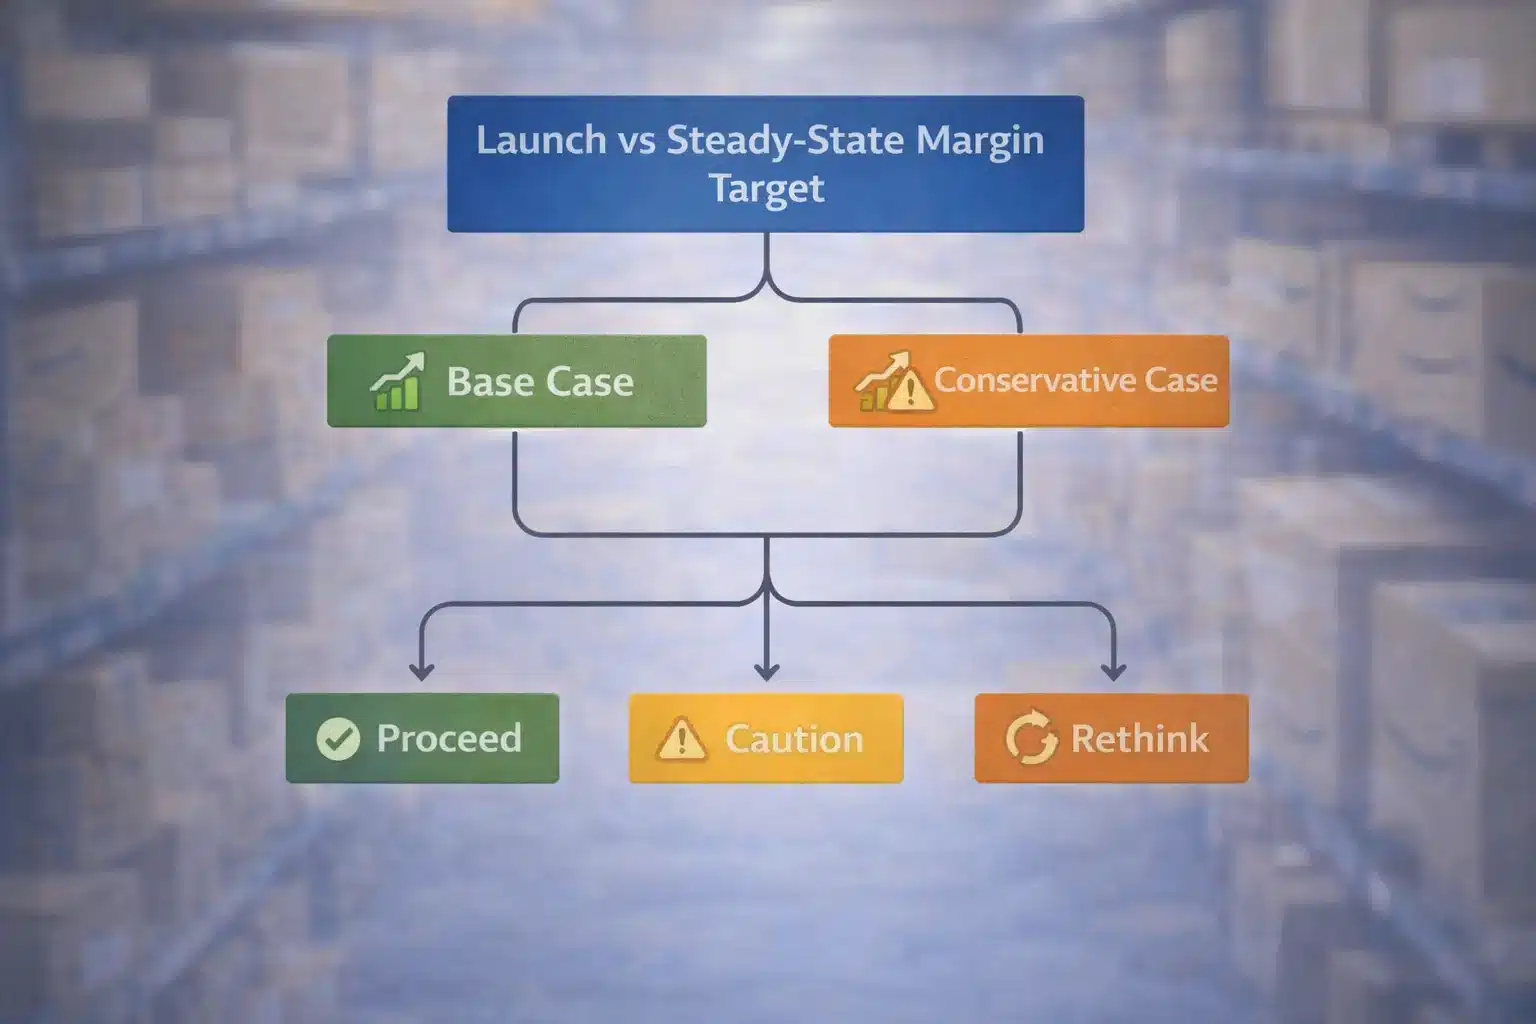
Boundary conditions:
- High-return products require a larger buffer.
- Heavy PPC dependence usually means you should be more conservative than your best-week data suggests.
A simple stress-test: base case vs conservative case
Stress-test the variables that most often surprise sellers:
- PPC/ad cost (higher than expected)
- Returns/refunds impact (worse than expected)
- Landed cost per unit (higher due to routing, seasonality, carton efficiency, or partial shipments)
- Inventory holding costs (storage exposure if sales are slower than planned)
How to interpret the result:
- If small changes wipe out most of your profit, the SKU is operating on a thin edge.
- If profit remains meaningful under conservative assumptions, your target is more resilient.
Caveat: Early launch data can be noisy. Revisit your stress test after you have stable traffic, conversion, and ad data.
If the conservative case feels fragile, it helps to know the most common red flags before you commit to a large reorder.
When margin is too low to be sustainable (red flags + exceptions)
A margin is “too low” when small, normal changes (ads cost, returns, fees, inbound cost) wipe out profit—or when cashflow and inventory risk become unmanageable.
Red flags (risk checklist):
- Your profit depends on “perfect” ad performance (one bad week turns profit negative).
- Returns/refunds routinely erase a meaningful share of profit.
- Inventory sits longer than planned, increasing storage exposure and forcing discounts.
- You frequently pay for rush shipping or emergency fixes due to stockouts.
- Landed cost assumptions are unstable because carton specs or consolidation plans change late.
When low margins can still work (and what must be true):
- Velocity is high and predictable.
- Returns are consistently low.
- Operational errors are rare because your prep/labeling process is controlled.
- You’re intentionally running low margins for a time-boxed reason (for example, launch), and you have a plan to improve.
Caveat: If you’re running low margins, time-box the strategy and track contribution margin closely so you don’t drift into permanent fragility.
If your margin is below target, the fastest wins usually come from tightening the math and attacking the biggest controllable cost drivers.
How to improve Amazon FBA profit margin (without only raising price)
You can often widen margin without triggering price wars by reducing waste and preventable costs—especially in ads, inbound planning, and packaging discipline.
A simple improvement sequence:
- Audit your per-SKU model
- Confirm your revenue is net of coupons/discounts.
- Confirm your cost stack includes ads, landed cost, prep/rework, and returns allowances.
- Identify the biggest swing factor
- For many sellers it’s PPC efficiency, returns, or landed cost per unit.
- Implement high-impact fixes
- Ads: reduce wasted spend, tighten targets, and measure against contribution margin (not vanity metrics).
- Packaging/prep: reduce damage and rework; improve labeling accuracy and verification.
- Inbound plan: improve carton planning, consolidation timing, and documentation consistency to avoid preventable exceptions.
- Inventory: reduce long holding periods and avoid stockouts that force emergency shipping.
- Measure and re-run the model
- Compare base case vs conservative case before and after changes.
Quick wins vs structural changes:
- Quick wins: fix missing cost lines, tighten ad waste, correct carton specs early, standardize labeling checks.
- Structural: rework packaging design, change sourcing terms, change inbound strategy, or reduce return drivers via product improvements.
Caveat: Avoid racing to the bottom on price. Price cuts can increase unit velocity while destroying contribution margin and cashflow.
FAQ
Q: What is considered a good profit margin for Amazon FBA sellers?
A: A “good” margin usually means net profit margin per SKU after Amazon fees and your real operating costs, with enough buffer to handle normal swings in ads, returns, and inbound costs. Many sellers treat low-to-mid double digit net margin as healthier than single digits, but the right target depends on category, PPC intensity, and landed cost. The safest approach is to calculate contribution margin per SKU and stress-test it with a conservative scenario.
Q: What’s the difference between gross profit margin and net profit margin for Amazon FBA?
A: Gross margin is what’s left after COGS; net margin is what’s left after you also account for the selling and operating costs you include in your model. Gross margin helps with sourcing comparisons, but it can hide the impact of Amazon fees, PPC, and landed cost. Contribution margin sits between them and is often the most useful layer for SKU-level pricing and reorder decisions.
Q: How do you calculate profit margin for an Amazon FBA product?
A: Use a per-SKU model: net profit per unit equals net revenue (after coupons/discounts) minus all costs you include (COGS, Amazon fees, PPC, landed cost per unit, prep/rework allowance, returns allowance). Then divide net profit by net revenue to get margin percentage. If ads and returns fluctuate, run a base case and a conservative case so you don’t over-trust your best-week numbers.
Q: What costs should be included when calculating Amazon FBA profit margin?
A: Include product costs (COGS), Amazon selling costs (referral and fulfillment categories that apply), ads and promotion impact, landed cost per unit (freight + delivery + duties/taxes where applicable), prep/label/kitting work, and an allowance for returns and exceptions (damage/rework/removal if relevant). Many “lost margin” surprises come from missing ads, landed cost, or rework/returns exposure.
Q: How do you use Amazon’s FBA Revenue Calculator to estimate profit margin?
A: Use it to estimate Amazon fees and compare FBA vs your own fulfillment, then plug those outputs into your per-SKU model. The calculator won’t capture your PPC costs, landed cost per unit, prep/kitting, or returns allowances—so you should add those manually. Treat it as a fee estimator and sanity check, not the full profitability model.
Q: When is an Amazon FBA profit margin too low to be sustainable?
A: It’s too low when small, normal changes (higher PPC, higher returns, higher inbound costs, slower sales causing storage exposure) wipe out profit or create cashflow stress. Low margins can still work if velocity is high, returns are reliably low, and operations are controlled—but it should be a deliberate, time-boxed strategy with close contribution-margin tracking.
Summary & Next Steps
Key takeaways:
- “Good” profit margin is only meaningful when you define the margin layer (gross vs contribution vs net) and include the full cost stack.
- Contribution margin per SKU is often the best decision tool for pricing and reorders; net margin is the longer-term sustainability check.
- A resilient target comes from stress-testing base vs conservative assumptions—especially for PPC, returns, and landed cost.
- Inbound logistics and prep discipline affect margin through landed cost per unit and avoidable rework risk.
What to do next (pick the scenario that matches you):
- If you’re launching: build a base case and conservative case, then time-box how long you’ll accept compressed margin while ads stabilize.
- If you’re reordering: update your model with real invoices and ad reports, then re-run the conservative case before committing to volume.
- If you source from multiple suppliers: lock carton specs, labeling plans, and consolidation timing early to reduce rework and cost surprises.
If you want to reduce “hidden margin leakage” from inbound planning and prep errors, a process-driven logistics and prep partner can help you standardize carton planning, labeling checks, and consolidation workflows. FBABEE works with Amazon sellers on China-side consolidation, prep, and door-to-door shipping (fbabee.com).


